The first 3 labs of this course
were devoted to learning the most basic functions of Erdas Imagine. For lab
four I was introduced to some of the more complex and interesting functions
which this program is capable of. For example I was required to delineate an
area of interest from a large satellite image, manipulate images to enhance
their ability to be analyzed, and used graphical modeling to distinguish areas
of an image where changes in vegetation have occurred.
Objective 1: Image Subsetting
This
objective of the lab involves subsetting an image by the use of the subset and
chip function of Erdas Imagine. The first step to using this function is
defining an area of interest (AOI) from an Image. There are two simple ways
that an AOI can be determined: by using an inquire box (figure 1) or by using a
georeferenced shapefile (figure 2). While using the inquire box function is
simple the shapfile AOI selection method is advantageous because it can display
predetermined boundaries easier and is not limited to rectangular shapes.
Figure 1. Left: original Image. Right: Inquire box subsetted image.
Figure 2. Left: original image, note polygons over Chippewa and Eau Claire counties. Right: shapefile defined subsetted
image.
Objective 2: Image
fusion
For
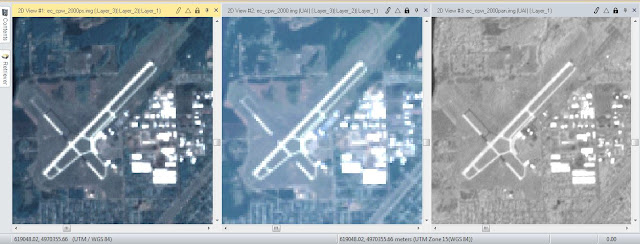
this objective I was able to improve the spatial resolution of an image by
merging a 30 meter reflective image with a 15 meter panchromatic image. The
pixel values were determined by the Erdas resolution merge function set to use
a multiplicative algorithm and nearest neighbor resampling technique. One can
see the differences between all three images below (Figure 3).
Figure 3. Left: resolution merged (Pansharpened) image. Center:
original Multispectral Image. Right: Original panchromatic image.
Objective 3: Basic
Radiometric Enhancement Techniques
With this
portion of the lab I used a haze reduction function on Erdas to improve the
spectral and radiometric clarity of the image. One can see the improvement of
contrast between both images below (Figure 4).
Figure 4. Left: original image. Right: Modified, haze
reduced image.
Objective 5: Resampling
For
this objective I was able to resample the image using both nearest neighbor and
bilinear interpolation. There is no difference, aside from the increased amount
of pixels, between the original image and the one resampled using the nearest
neighbor method. There was a much more pronounced difference between the image
resampled using the bilinear interpolation technique and the original. The
image is more spatially accurate and many features are smoothed out. One can
observe these differences below (figure 5).
Figure 5. Left: original image. Center: nearest neighbor
resampled image. Right: bilinear interpolation resampled image.
Objective 6: Image Mosaicking
For
this objective I was tasked with creating several image mosaics. The first
mosaics was created using the Erdas function Mosaic Express. While this
technique of image merging was easy to set up and quick to render on the
computer the final image left much to be desired (Figure 6). There was not a
smooth transition between the images making it quite obvious where the original
image’s borders were. One advantage of the function is how the radiometric
changes increased the contrast of the output image.
Figure 6. Left: original images. Right: Erdas Mosiac Express
image.
Objective 7: Image
differencing
This
section of the lab was designed to introduce students to the concept of image
differencing, a technique used to see changes in one place over time. After
opening two images of the same area that were taken 20 years apart I used the
Erdas Two Image Functions to perform a binary change detection between band 4
on the images. After running the process no change was apparent in the new
image so I was required to manipulate the histogram portion of the image
metadata so as to determine the areas brightness changed the most (Figure 8).
Figure 8. Binary change image histogram.
Figure 9. Left: subtracted values between 1991 and 2011
images. Right: Highlighting of pixels that had the most change in brightness
values.
Figure 10. Completed map showing binary change.


